
The latest postdoc census data - why the number of US postdocs has decreased, but also maybe hasn’t?
As some of you may know, I’ve been constantly refreshing the National Science Foundation’s site for the Survey of Graduate Students and Postdoctorates in Science and Engineering (better known as the GSS), which is a survey administered to universities carrying out an annual census of graduate students and postdocs. That’s because the data for Fall 2020 was eagerly anticipated (perhaps only by me ¯\_(ツ)_/¯) and yesterday I was rewarded with the appearance of the data! I’ve taken a quick gander at the postdoc data, and wanted to share some quick thoughts.
Mostly I want to get this post out into the world because I’m pretty sure we might have a repeat of “the number of postdocs is in decline” narrative that happened a few years ago, which myself, Chris Pickett and Adriana Bankston rebutted in an analysis of the underlying data. Particularly the primary cause for this decline was given as being “postdocs are now actively choosing to leave academia”, which simply wasn’t happening, and was confusing to all of us in the postdoc population. We suspected there was in fact a bubble of retention of people in postdocs from 2008-10, which corrected downwards to the previous trend line by 2013 (is there any reason postdocs may have stayed in postdoc positions longer after 2008?).
As a data nerd, I want us to be doing a better job of interpreting data that can affect policy decisions about whole populations of scientists - so I want to get some quick thoughts down here to get the discussion going, and I’ll likely write this up as a more detailed analysis in the near future.
The TL;DR: the number of “postdocs” in the GSS is down from 2019, and there could be some logical explanations for that - but also, the underlying quality of this data means that there may not actually be a real decrease. Read on for more!
Who is a “postdoc”?
Let me start off by defining what I mean by “postdocs”. The NSF has data tables on postdoctoral appointees, but also has data on “doctorate-holding nonfaculty researchers”. Over recent years, with increasing scrutiny on the length of time people are doing postdocs, in supposedly “temporary” “training” positions, there has been a movement to cap the length of time on a postdoc to 5 years. But in reality, many of these people move into post-postdoc roles, with a variety of titles, broadly under the term of “staff researcher” or “staff scientist”. For this reason, when I look at data about “postdocs”, I combine these two datasets together, ever since the NSF started reporting on “doctorate-holding nonfaculty researchers” in 2014.
In fairness, many of these people in these roles do receive improved contracts, salaries and benefits. And also, this population will include genuine staff scientists, who do have permanent roles, particularly those who run core facilities in institutions. But we’re unable to parse these populations out, and I have enough information from partners to know that postdocs are being hidden in this post-postdoc miasma, to justify to myself why I should combine these two populations in my analyses. For the purposes of this, I’m going to use NSF’s terminology and refer to this group as “Doctoral Degree Recipients”, or DDRS (I know it’s not perfect, but let’s agree to disagree and move on to look at the data).
So…how many “postdocs” - sorry, “DDRs” are there?
Based on what I’ve said, you may be tempted to look at Tables 5-5 and 5-6, for example, and add the numbers for all people at all institutions (65,681 and 29,661) to arrive at 95342. I wouldn’t, if I were you, because if you sum all the numbers actually listed for each institution listed below these numbers, and combine them, you get 94091. As I work in a groaning spreadsheet that looks at the institutional number for each year, I use this number.
There may well be a good reason these numbers don’t agree - I haven’t read through the technical notes yet - but this I think is a pretty good intro into why I handle the GSS data with extreme caution, and why I avoid drawing conclusions to make grand pronouncements on postdoc numbers (as should you, too!).
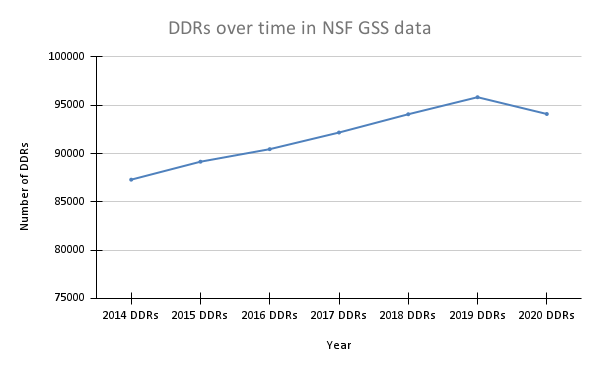
Here’s my plot of DDRs over time:

Plot of number of DDRs (“postdocs” and “post-postdocs”) in the National Science Foundation’s Graduate Student Survey.
Here it is again but setting the bottom of the y-axis at 75,000:
Plot of number of DDRs (“postdocs” and “post-postdocs”) in the National Science Foundation’s Graduate Student Survey, with y-axis starting at 75,000.
First of all, some people are surprised that I estimate the number of postdocs in the US (in ALL disciplines) is 100,000. Perhaps now you see my basis for that guesstimate.
But more importantly, you can see there' is a pretty stable trend line since 2014 (perhaps you can see this is why I combine postdoc and “post-postdoc” data). And there is indeed a drop from 2019 to 2020.
Why is there a drop?
As I was anticipating this data, I tweeted out some predictions about how data for the next few years could go.
My predictions were that domestic postdocs (U.S. citizens and permanent residents) and foreign postdocs who have sufficient time on their current visas might behave like the postdocs post-Great Recession, and just stick it out for a bit. This would cause the number to go up.
However, just over half of all postdocs in STEM are foreigners on temporary visas in the NSF’s data (and in biomedicine, it’s estimated that as many as 2/3 are on temporary visas). There is a constant supply of foreigners (like me!) who come to the U.S. to postdoc after doing their PhDs on temporary visas (I started on a J-1). From March 2020 onwards, basically no-one foreign could enter the country, including new postdocs. This data is from Fall 2020, so would be around 6 months into this scenario. This would mean a major supply of U.S. postdocs was essentially turned off, and would cause the number to go down.
It’s unclear what postdocs on expiring visas would do, but my guess is that because they couldn’t go anywhere, they may have stayed in the U.S. - whether they were able to work as postdocs or not was probably variable.
Overall, then, I guessed the number might tend downwards slightly because of the influence of foreigners. Because the situation was basically the same through most of 2021, next year’s data may shed further light on this.
So the number of DDRs went down - right?
Weeeeeeeellllllllll…..
Here’s the thing. These changes in numbers depend on how 330-odd institutions enter the data. As we talked about in our prior work, we found that actually the variation from year-to-year within single institutions was so high that the GSS may show a general overall level of U.S. STEM DDRs, but e.g. in a year where an institution does an internal admin revamp and suddenly “finds” or “loses” hundreds of postdocs - which has happened - or, perhaps, the single person who entered the data resigns and no-one else takes up the work, and data is not entered giving a “0” for that institution after reporting hundreds for several years, then suddenly the changes we’re seeing in the plots above become very hard to be sure of.
Here are some examples from this year. I looked at the top and bottom "gainers” and “losers” of DDRs, just by subtracting their 2020 numbers from 2019.
The top 10 “gainers” were:
U. California, Davis
Georgia Institute of Technology
Thomas Jefferson U.
Scripps Research Institute
U. Iowa
Texas A&M U.
U. Chicago
Washington U., Saint Louis
New York U.
Rush U.
UC Davis and Georgia Tech both saw a whopping 46% increase on their postdoc numbers from 2019. Scripps and U of Iowa went up by a third. Texas A&M by a quarter. UChicago, WashU and NYU all added 100-odd postdocs to their population.
Thomas Jefferson added 200 postdocs - but in 2018 they had 200, and in 2019 - 0. It seems they skipped a year. So perhaps we should revise the 2019 numbers up by 200? Same for Rush - in fact their data in my spreadsheet for the last few years goes: 2016: 35; 2017: 0; 2018: 97; 2019: 0; 2020: 102. Again - should we add 100 to 2019’s data?
That would actually make the data more striking - even more of a decline this year! But wait, here’s the biggest “losers” of DDRs:
Icahn School of Medicine at Mt. Sinai
Stanford U.
U. Michigan
U. California, Berkeley
U. California, Riverside
City of Hope, Irell and Manella Graduate School of Biological Sciences
U. California, San Diego
Harvard U.
Rensselaer Polytechnic Institute, Troy
U. California, Los Angeles
Icahn lost 662 DDRs - because they don’t have any data entered for 2020. Same with RPI, at number 9 - they lost 182 but only because they have no entry this year. So if I were to add 850ish DDRs to 2020’s total to account for this, assuming no change, the size of the apparent decline decreases again.
This is just for the extremes - if you look through the data you’ll spot, for example, that UC Santa Cruz hasn’t entered data for the second year running - at last count, they had 333 in 2018. Same for UMD Baltimore - no data in two years, in 2019 they had 332 postdocs.
By the way, in case you’re wondering, here’s what the number of DDRs per institution looks like:

Number of DDRs per institution, ordered from highest to lowest.
You can see the Empire of Harvard on the left - it includes Harvard’s campus in Cambridge, AND Harvard Medical School, AND all the affiliated hospitals that populate the Longwood Ave area in Boston - and even to 2nd, Stanford, there’s a 50% decrease. There’s a huge concentration of postdocs at a very small number of institutions, meaning that these institutions can have an outsized effect on the data if there are barriers to accurate data collection.
What’s the takeaway?
Be very careful with postdoc census data from the GSS.
It’s pretty clear looking at GSS data that the data is very good on graduate students, on which there is a lot of focus (perhaps indicated by the fact that this is referred to as the “GSS” or “Graduate Student Survey”).
The reasons for postdoc data being less good are many and tedious for anyone unfortunate to sit next to me at dinner at a conference, but if you compare grad students and postdocs, there’s simply more oversight of the student population - they tend to be in programs admitted at a higher level than an individual lab; they don’t have dozens of different titles depending on various minor administrative conditions; there are more staff and resources dedicated to grad students than postdocs at institutions - it all adds up.
So before we all panic too much about what the numbers tell us - we should take into account what they could be saying, and then consider whether that’s the picture we’re seeing with much deeper dives. For example, we suggested previously that there could be an “index” of a number of institutions with good data collection policies and procedures that could be used to track the population. I personally have a sense of some of those places, but not a good enough number to be able to create such an index yet.
As ever, being scientists, we should fully interrogate the data we have before us. As one colleague said to me recently, “there’s no use arguing over p-values without first appreciating what conditions the underlying experiment was run under”.
Please comment/send me your thoughts! I will look into doing a deeper dive of the data for the past near-decade and publishing something more rigorous, but I hope this was interesting!